kurashigram › Cost of living › Housing › Private rent 日本語
Where is Private rent cheapest?
81 cities, cheapest first (2026-09).
Details
Per month, per 3.3 m² (1 tsubo). Prices the Statistics Bureau of Japan surveys in 81 cities every month. Nothing is estimated. A city name opens every item surveyed in that city.
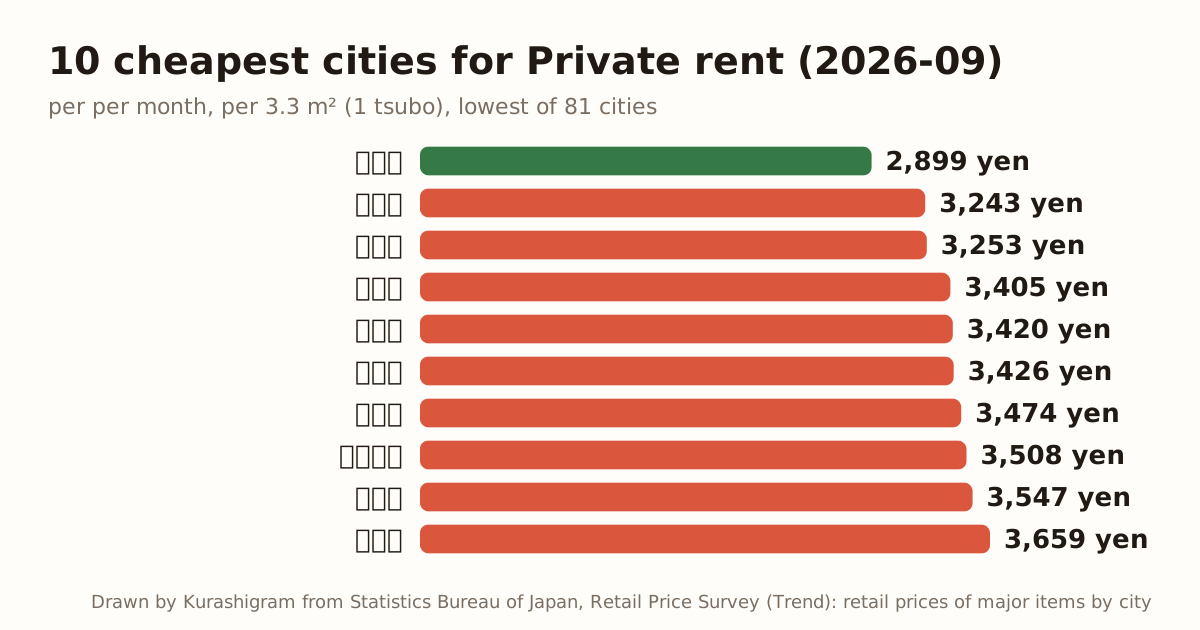
81 cities, lowest first (2026-09)
| City | Price | vs median | vs prev. month | |
|---|---|---|---|---|
| 1 | 八戸市 | 2,899 yen | -30.1% | +0.0% |
| 2 | 今治市 | 3,243 yen | -21.9% | -0.6% |
| 3 | 函館市 | 3,253 yen | -21.6% | -0.4% |
| 4 | 豊橋市 | 3,405 yen | -18.0% | -0.2% |
| 5 | 佐賀市 | 3,420 yen | -17.6% | -0.1% |
| 6 | 松阪市 | 3,426 yen | -17.4% | -0.5% |
| 7 | 旭川市 | 3,474 yen | -16.3% | +0.1% |
| 8 | 和歌山市 | 3,508 yen | -15.5% | -0.1% |
| 9 | 郡山市 | 3,547 yen | -14.5% | -0.0% |
| 10 | 富士市 | 3,659 yen | -11.8% | -0.1% |
| 11 | 浜松市 | 3,660 yen | -11.8% | -0.0% |
| 12 | 山口市 | 3,661 yen | -11.8% | +0.2% |
| 13 | 青森市 | 3,685 yen | -11.2% | -0.3% |
| 14 | 松山市 | 3,687 yen | -11.2% | -0.1% |
| 15 | 宮崎市 | 3,694 yen | -11.0% | +0.4% |
| 16 | 日立市 | 3,718 yen | -10.4% | -0.2% |
| 17 | 徳島市 | 3,762 yen | -9.3% | -0.1% |
| 18 | 大分市 | 3,767 yen | -9.2% | +0.1% |
| 19 | 金沢市 | 3,769 yen | -9.2% | -0.1% |
| 20 | 宇部市 | 3,769 yen | -9.2% | +0.4% |
| 21 | 北九州市 | 3,778 yen | -9.0% | -0.1% |
| 22 | 姫路市 | 3,780 yen | -8.9% | +0.1% |
| 23 | 福山市 | 3,795 yen | -8.6% | -0.1% |
| 24 | 鳥取市 | 3,796 yen | -8.5% | -0.2% |
| 25 | 熊本市 | 3,805 yen | -8.3% | +0.1% |
| 26 | 山形市 | 3,843 yen | -7.4% | -0.1% |
| 27 | 小山市 | 3,844 yen | -7.4% | -0.3% |
| 28 | 前橋市 | 3,847 yen | -7.3% | -0.1% |
| 29 | 岐阜市 | 3,864 yen | -6.9% | -0.2% |
| 30 | 福井市 | 3,878 yen | -6.6% | +0.0% |
| 31 | 松江市 | 3,890 yen | -6.3% | -0.3% |
| 32 | 富山市 | 3,916 yen | -5.6% | +0.1% |
| 33 | 水戸市 | 3,917 yen | -5.6% | +0.0% |
| 34 | 長野市 | 3,928 yen | -5.3% | +0.0% |
| 35 | 新潟市 | 3,964 yen | -4.5% | +0.3% |
| 36 | 福島市 | 4,043 yen | -2.6% | -0.0% |
| 37 | 秋田市 | 4,061 yen | -2.1% | +0.5% |
| 38 | 佐世保市 | 4,072 yen | -1.9% | +0.1% |
| 39 | 枚方市 | 4,116 yen | -0.8% | -0.1% |
| 40 | 盛岡市 | 4,131 yen | -0.5% | +0.0% |
| 41 | 高知市 | 4,150 yen | +0.0% | +0.0% |
| 42 | 伊丹市 | 4,156 yen | +0.1% | -0.0% |
| 43 | 岡山市 | 4,177 yen | +0.7% | +0.1% |
| 44 | 長岡市 | 4,192 yen | +1.0% | -0.1% |
| 45 | 松本市 | 4,216 yen | +1.6% | +0.0% |
| 46 | 甲府市 | 4,229 yen | +1.9% | +0.0% |
| 47 | 札幌市 | 4,231 yen | +2.0% | -0.0% |
| 48 | 宇都宮市 | 4,256 yen | +2.6% | -0.3% |
| 49 | 大津市 | 4,285 yen | +3.3% | +0.1% |
| 50 | 津市 | 4,291 yen | +3.4% | +0.4% |
| 51 | 高松市 | 4,339 yen | +4.6% | +0.3% |
| 52 | 那覇市 | 4,428 yen | +6.7% | +0.0% |
| 53 | 鹿児島市 | 4,517 yen | +8.8% | -0.0% |
| 54 | 東大阪市 | 4,531 yen | +9.2% | +0.0% |
| 55 | 広島市 | 4,551 yen | +9.7% | -0.1% |
| 56 | 静岡市 | 4,590 yen | +10.6% | -0.7% |
| 57 | 熊谷市 | 4,611 yen | +11.1% | -0.1% |
| 58 | 福岡市 | 4,933 yen | +18.9% | +0.4% |
| 59 | 長崎市 | 5,013 yen | +20.8% | -0.3% |
| 60 | 千葉市 | 5,080 yen | +22.4% | +0.2% |
| 61 | 奈良市 | 5,130 yen | +23.6% | +0.1% |
| 62 | 柏市 | 5,177 yen | +24.7% | -0.0% |
| 63 | 名古屋市 | 5,219 yen | +25.8% | +0.1% |
| 64 | 仙台市 | 5,226 yen | +25.9% | +0.4% |
| 65 | 堺市 | 5,304 yen | +27.8% | +0.5% |
| 66 | 所沢市 | 5,307 yen | +27.9% | -0.1% |
| 67 | 藤沢市 | 5,481 yen | +32.1% | +0.1% |
| 68 | 神戸市 | 5,511 yen | +32.8% | +0.0% |
| 69 | 川口市 | 5,603 yen | +35.0% | +0.0% |
| 70 | 相模原市 | 5,844 yen | +40.8% | +0.1% |
| 71 | 京都市 | 6,021 yen | +45.1% | +0.0% |
| 72 | さいたま市 | 6,030 yen | +45.3% | +0.1% |
| 73 | 八王子市 | 6,097 yen | +46.9% | +0.1% |
| 74 | 立川市 | 6,347 yen | +52.9% | -1.3% |
| 75 | 大阪市 | 6,374 yen | +53.6% | +0.3% |
| 76 | 西宮市 | 6,600 yen | +59.0% | -0.1% |
| 77 | 府中市 | 6,786 yen | +63.5% | -0.3% |
| 78 | 横浜市 | 6,992 yen | +68.5% | +1.4% |
| 79 | 川崎市 | 7,462 yen | +79.8% | -0.1% |
| 80 | 浦安市 | 7,659 yen | +84.6% | +0.2% |
| 81 | 東京都区部 | 10,074 yen | +142.7% | +0.3% |
Monthly median across cities
| Month | Median | Cities | Lowest | Highest |
|---|---|---|---|---|
| 2020-01 | 3,893 yen | 81 | 旭川市 3,026 | 東京都区部 8,796 |
| 2020-02 | 3,894 yen | 81 | 旭川市 3,019 | 東京都区部 8,796 |
| 2020-03 | 3,892 yen | 81 | 旭川市 3,010 | 東京都区部 8,822 |
| 2020-04 | 3,853 yen | 81 | 旭川市 3,014 | 東京都区部 8,816 |
| 2020-05 | 3,852 yen | 81 | 旭川市 3,016 | 東京都区部 8,779 |
| 2020-06 | 3,883 yen | 81 | 旭川市 3,005 | 東京都区部 8,770 |
| 2020-07 | 3,881 yen | 81 | 旭川市 3,003 | 東京都区部 8,767 |
| 2020-08 | 3,871 yen | 81 | 旭川市 3,013 | 東京都区部 8,770 |
| 2020-09 | 3,858 yen | 81 | 旭川市 3,005 | 東京都区部 8,771 |
| 2020-10 | 3,861 yen | 81 | 旭川市 3,005 | 東京都区部 8,776 |
| 2020-11 | 3,862 yen | 81 | 旭川市 3,003 | 東京都区部 8,822 |
| 2020-12 | 3,863 yen | 81 | 旭川市 3,007 | 東京都区部 8,828 |
| 2021-01 | 3,857 yen | 81 | 旭川市 3,014 | 東京都区部 8,806 |
| 2021-02 | 3,857 yen | 81 | 旭川市 3,032 | 東京都区部 8,811 |
| 2021-03 | 3,853 yen | 81 | 旭川市 3,036 | 東京都区部 8,783 |
| 2021-04 | 3,856 yen | 81 | 旭川市 3,034 | 東京都区部 8,782 |
| 2021-05 | 3,854 yen | 81 | 旭川市 3,032 | 東京都区部 8,788 |
| 2021-06 | 3,850 yen | 81 | 旭川市 3,024 | 東京都区部 8,788 |
| 2021-07 | 3,854 yen | 81 | 旭川市 3,025 | 東京都区部 8,807 |
| 2021-08 | 3,852 yen | 81 | 旭川市 3,018 | 東京都区部 8,809 |
| 2021-09 | 3,847 yen | 81 | 旭川市 3,039 | 東京都区部 8,787 |
| 2021-10 | 3,850 yen | 81 | 旭川市 3,040 | 東京都区部 8,792 |
| 2021-11 | 3,851 yen | 81 | 旭川市 3,042 | 東京都区部 8,789 |
| 2021-12 | 3,853 yen | 81 | 旭川市 3,056 | 東京都区部 8,795 |
| 2022-01 | 3,855 yen | 81 | 旭川市 3,053 | 東京都区部 8,784 |
| 2022-02 | 3,854 yen | 81 | 旭川市 3,052 | 東京都区部 8,811 |
| 2022-03 | 3,859 yen | 81 | 旭川市 3,050 | 東京都区部 8,813 |
| 2022-04 | 3,873 yen | 81 | 旭川市 3,046 | 東京都区部 8,801 |
| 2022-05 | 3,917 yen | 81 | 旭川市 3,055 | 東京都区部 8,816 |
| 2022-06 | 3,927 yen | 81 | 旭川市 3,048 | 東京都区部 8,797 |
| 2022-07 | 3,926 yen | 81 | 旭川市 3,057 | 東京都区部 8,810 |
| 2022-08 | 3,924 yen | 81 | 旭川市 3,051 | 東京都区部 8,817 |
| 2022-09 | 3,914 yen | 81 | 旭川市 3,047 | 東京都区部 8,818 |
| 2022-10 | 3,916 yen | 81 | 旭川市 3,046 | 東京都区部 8,804 |
| 2022-11 | 3,919 yen | 81 | 旭川市 3,056 | 東京都区部 8,805 |
| 2022-12 | 3,926 yen | 81 | 旭川市 3,050 | 東京都区部 8,795 |
| 2023-01 | 3,897 yen | 81 | 旭川市 3,044 | 東京都区部 8,809 |
| 2023-02 | 3,896 yen | 81 | 旭川市 3,036 | 東京都区部 8,820 |
| 2023-03 | 3,894 yen | 81 | 旭川市 3,035 | 東京都区部 8,822 |
| 2023-04 | 3,884 yen | 81 | 旭川市 3,044 | 東京都区部 8,804 |
| 2023-05 | 3,892 yen | 81 | 旭川市 3,030 | 東京都区部 8,794 |
| 2023-06 | 3,928 yen | 81 | 旭川市 3,034 | 東京都区部 8,788 |
| 2023-07 | 3,926 yen | 81 | 旭川市 3,040 | 東京都区部 8,798 |
| 2023-08 | 3,936 yen | 81 | 旭川市 3,049 | 東京都区部 8,801 |
| 2023-09 | 3,926 yen | 81 | 旭川市 3,051 | 東京都区部 8,789 |
| 2023-10 | 3,922 yen | 81 | 旭川市 3,049 | 東京都区部 8,787 |
| 2023-11 | 3,919 yen | 81 | 旭川市 3,046 | 東京都区部 8,788 |
| 2023-12 | 3,920 yen | 81 | 旭川市 3,042 | 東京都区部 8,800 |
| 2024-01 | 4,135 yen | 81 | 八戸市 3,021 | 東京都区部 9,706 |
| 2024-02 | 4,103 yen | 81 | 八戸市 3,029 | 東京都区部 9,707 |
| 2024-03 | 4,134 yen | 81 | 八戸市 3,010 | 東京都区部 9,712 |
| 2024-04 | 4,129 yen | 81 | 八戸市 3,010 | 東京都区部 9,732 |
| 2024-05 | 4,136 yen | 81 | 八戸市 3,012 | 東京都区部 9,750 |
| 2024-06 | 4,148 yen | 81 | 八戸市 3,007 | 東京都区部 9,737 |
| 2024-07 | 4,137 yen | 81 | 八戸市 2,991 | 東京都区部 9,747 |
| 2024-08 | 4,153 yen | 81 | 八戸市 2,991 | 東京都区部 9,733 |
| 2024-09 | 4,155 yen | 81 | 八戸市 2,928 | 東京都区部 9,751 |
| 2024-10 | 4,147 yen | 81 | 八戸市 2,946 | 東京都区部 9,743 |
| 2024-11 | 4,156 yen | 81 | 八戸市 2,950 | 東京都区部 9,748 |
| 2024-12 | 4,093 yen | 81 | 八戸市 2,915 | 東京都区部 9,764 |
| 2025-01 | 4,131 yen | 81 | 八戸市 2,911 | 東京都区部 9,812 |
| 2025-02 | 4,129 yen | 81 | 八戸市 2,907 | 東京都区部 9,826 |
| 2025-03 | 4,150 yen | 81 | 八戸市 2,908 | 東京都区部 9,603 |
| 2025-04 | 4,159 yen | 81 | 八戸市 2,920 | 東京都区部 9,702 |
| 2025-05 | 4,155 yen | 81 | 八戸市 2,923 | 東京都区部 9,743 |
| 2025-06 | 4,147 yen | 81 | 八戸市 2,920 | 東京都区部 9,750 |
| 2025-07 | 4,136 yen | 81 | 八戸市 2,918 | 東京都区部 9,749 |
| 2025-08 | 4,131 yen | 81 | 八戸市 2,916 | 東京都区部 9,757 |
| 2025-09 | 4,131 yen | 81 | 八戸市 2,915 | 東京都区部 9,987 |
| 2025-10 | 4,125 yen | 81 | 八戸市 2,912 | 東京都区部 9,894 |
| 2025-11 | 4,144 yen | 81 | 八戸市 2,913 | 東京都区部 9,902 |
| 2025-12 | 4,144 yen | 81 | 八戸市 2,903 | 東京都区部 9,905 |
| 2026-01 | 4,150 yen | 81 | 八戸市 2,886 | 東京都区部 9,904 |
| 2026-02 | 4,134 yen | 81 | 八戸市 2,883 | 東京都区部 9,909 |
| 2026-03 | 4,136 yen | 81 | 八戸市 2,880 | 東京都区部 9,892 |
| 2026-04 | 4,133 yen | 81 | 八戸市 2,891 | 東京都区部 9,915 |
| 2026-05 | 4,148 yen | 81 | 八戸市 2,886 | 東京都区部 9,937 |
| 2026-06 | 4,138 yen | 81 | 八戸市 2,906 | 東京都区部 9,958 |
| 2026-07 | 4,133 yen | 81 | 八戸市 2,907 | 東京都区部 9,980 |
| 2026-08 | 4,148 yen | 81 | 八戸市 2,898 | 東京都区部 10,048 |
| 2026-09 | 4,150 yen | 81 | 八戸市 2,899 | 東京都区部 10,074 |
To cite: Source: Statistics Bureau of Japan, Retail Price Survey (Trend): retail prices of major items by city. Via kurashigram (https://kurashigram.com/en/cost/item/3001/, table for 2026-09, retrieved 2026-10-25 14:15).
Source: Statistics Bureau of Japan, Retail Price Survey (Trend): retail prices of major items by city. “vs median” is the difference from the median of cities with a value that month; “vs prev. month” compares the same city with its previous surveyed month. Machine-readable: this item as a data file · stat.go.jp